

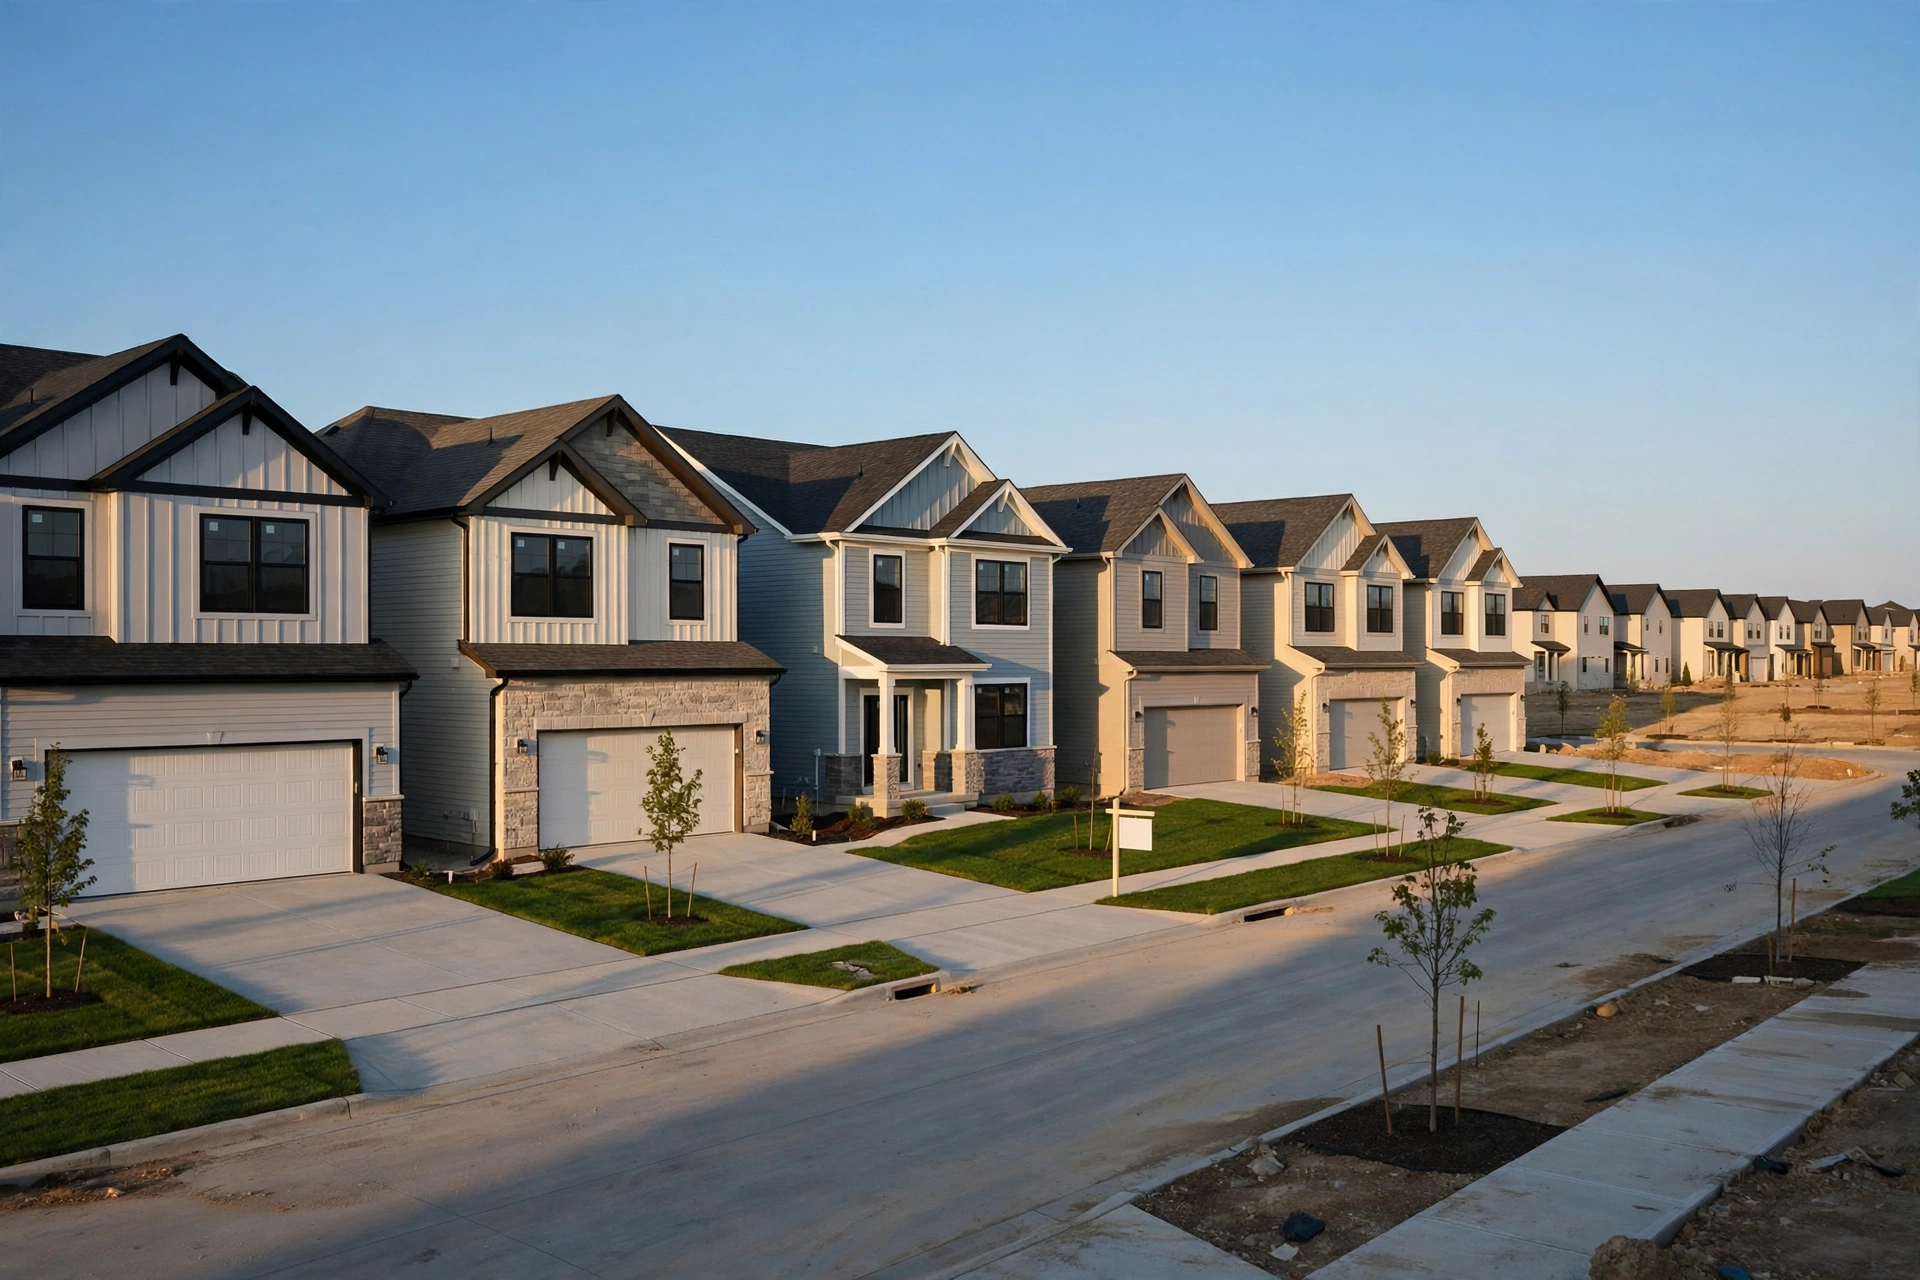
New home prices are dropping, and this time the numbers back up the headline. The median new house sold in the United States went for $400,400 in September 2026, down 3.9% from $416,800 a year earlier, according to the U.S. Census Bureau and the Department of Housing and Urban Development. The average new home price fell further, down 6.7% year over year to $472,800, a drop the Census Bureau calls statistically significant.
Builders are not waiting for buyers to come back. In October, 43% of builders cut prices, the highest share the National Association of Home Builders has recorded since 2020, and 65% offered sales incentives such as mortgage rate buydowns. Builder confidence fell to 29, its lowest reading since June 2012.
This article sets out what the latest data actually shows, how new homes now compare with existing homes, and what buyers should ask for before signing a contract.
The Numbers at a Glance
- Median new home price: $400,400 in September 2026, down 3.9% from $416,800 in September 2025, according to the Census Bureau and HUD.
- Average new home price: $472,800, down 6.7% year over year, the one price change in the September report the Census Bureau calls statistically significant.
- New home sales pace: 676,000 a year on a seasonally adjusted basis, down 5.3% from a year earlier.
- New homes for sale: 476,000 at the end of September, equal to 8.4 months of supply at the current sales pace.
- Builders cutting prices: 43% in October 2026, by an average of 6%, with 65% using sales incentives, according to the National Association of Home Builders.
- Overall home prices: the median sale price across all homes was $388,613 in the four weeks ending 8 November, down 0.9% from a year earlier, the fourth straight weekly year-over-year fall, according to Redfin.
- Mortgage rates: the 30-year fixed rate averaged 7.11% in the week ending 12 November, its lowest in seven weeks, according to Freddie Mac.
What the Census Data Shows
The Census Bureau and HUD released the September new home sales report on 27 October 2026, and the price figures point in the same direction. The median sales price of a new house was $400,400, up 3.9% from August’s $385,400 but down 3.9% from $416,800 in September 2025. The average sales price was $472,800, up 0.4% from August and down 6.7% from $506,800 a year earlier.
One caution matters here. The Census Bureau marks both median price changes as statistically uncertain, which means the survey’s margin of error is wide enough that the true change could be smaller, or even flat. The average price fall of 6.7% is the exception: it clears the Bureau’s own test, so it is the most solid evidence in the report that new home prices really did fall over the year.
Sales are also soft. New single-family houses sold at a seasonally adjusted annual rate of 676,000 in September, down 0.6% from a revised 680,000 in August and 5.3% below the 714,000 pace of September 2025. Neither change is statistically significant on its own, but sales for the first nine months of 2026 ran 2.9% behind the same period of 2025.
The inventory figure is the one builders cannot argue with. There were 476,000 new houses for sale at the end of September, which works out to 8.4 months of supply at the current sales pace. That is the stock builders have to move, and it is why price cuts and incentives are spreading. The Census Bureau’s October report is due on 25 November.
Builders Are Cutting Prices
The National Association of Home Builders’ October survey, released on 19 October, shows how far builders have gone to keep homes moving. The share of builders cutting prices reached 43%, the highest recorded between 2020 and 2026, and those who cut took off 6% on average, the seventh straight month at that level. On a $400,000 home, a 6% cut is $24,000. At the same time, 65% of builders used sales incentives, the 19th straight month in which at least 60% did so.
Builder confidence tells the same story. The NAHB/Wells Fargo Housing Market Index fell three points to 29 in October, its lowest since June 2012. Current sales conditions scored 33, sales expectations for the next six months scored 32, and prospective buyer traffic scored just 18, its lowest since April 2012. The association pointed to mortgage rates above 7%, higher energy and material costs, and lot and labour conditions.
The public builders’ own earnings confirm the pressure. Meritage Homes said its average closing price fell 4% year over year to $365,000 in the third quarter, mainly because of higher incentives, rate buydowns and geographic mix, and its home closing gross margin fell to 17.4% from 19.1%. Century Communities said the average price of its home deliveries fell to $345,000 from $384,200 a year earlier, and its chief executive said incentives on third-quarter deliveries averaged about 13% of the price, with fourth-quarter incentives expected to run 200 to 250 basis points higher.
| Measure | Latest figure | Change from a year earlier | Source |
|---|---|---|---|
| Median new home price, September 2026 | $400,400 | Down 3.9% | Census Bureau and HUD |
| Average new home price, September 2026 | $472,800 | Down 6.7% | Census Bureau and HUD |
| New homes for sale, end of September | 476,000 | 8.4 months of supply | Census Bureau and HUD |
| Builders cutting prices, October 2026 | 43% | Highest since 2020 | NAHB |
| Builders using incentives, October 2026 | 65% | 19th straight month at 60% or more | NAHB |
| Median sale price, all homes, 4 weeks to 8 November | $388,613 | Down 0.9% | Redfin |
| Median existing-home price, October 2026 | $416,700 | Up 0.4% | National Association of Realtors |
New Homes Now Cost Less Than Existing Homes
Here is the twist that makes this drop matter for buyers. The median existing home sold for $416,700 in October 2026, according to the National Association of Realtors, up 0.4% from a year earlier. That is $16,300 more than the $400,400 median for a new home in September. The two figures cover different months, so the comparison is approximate, but the direction is clear: for the first time in years, the typical new home is cheaper than the typical existing home.
The resale market is otherwise frozen. Existing-home sales fell 5.5% in October to a seasonally adjusted annual rate of 3.75 million, the slowest pace since August 2010, according to NAR. Sales were down 8.8% from a year earlier. The 30-year fixed mortgage rate averaged 7.33% in October, up from 6.25% a year earlier, and NAR chief economist Lawrence Yun said home buying is difficult when mortgage rates have climbed to their highest levels since 2000, apart from a single month in 2023.
Yet existing-home prices have still not fallen. The $416,700 median marked the 40th straight month of year-over-year price increases. The reason is supply: only 1.59 million existing homes were for sale in October, a 5.1-month supply, far tighter than the 8.4 months of new homes on the market. Existing homeowners with low locked-in rates are mostly staying put, so resale supply stays tight and resale prices hold. Builders, by contrast, have to sell what they have built, so they cut prices.
The wider market confirms the split. Redfin’s update for the four weeks ending 8 November put the median sale price at $388,613, down 0.9% from a year earlier, the fourth straight weekly decline after three years of increases. About 21% of listings had price cuts, the typical home sold for about 98.2% of its asking price, and pending sales sat at the lowest level in Redfin’s records, which go back to 2021. Redfin counts roughly half a million more sellers than buyers in the market. The median monthly mortgage payment fell to $2,755, its lowest in six weeks.
Why Prices Are Falling
Three forces are pushing new home prices down at once.
Mortgage rates are still above 7%. The 30-year fixed rate averaged 7.33% in October, and even after easing to 7.11% in the week ending 12 November, it remains far above the 6.19% of a year earlier. At those rates, the monthly payment prices many buyers out, so builders have to bridge the gap themselves.
Inventory has piled up. With 476,000 new homes for sale and 8.4 months of supply, builders are carrying far more stock than a balanced market needs. Redfin describes four to five months as balanced. Every month a finished home sits unsold costs the builder money, which is why finished homes, known as spec homes, are where the deepest cuts appear.
Buyer traffic has dried up. The NAHB’s buyer traffic index scored 18 in October, its lowest since April 2012. When few buyers are walking through the door, builders compete on price and on incentives instead.
What It Means If You Are Buying
A falling median price does not mean every new home is 4% cheaper, and it does not mean prices will keep falling. The median moves when the mix of homes sold changes, and builders are selling more smaller, cheaper homes alongside cutting prices. Here is how to use the current market.
Ask for a price cut first, then compare it with a buydown. Builders often prefer to offer a mortgage rate buydown, because a price cut goes on the public record and becomes a comparable sale for every other home in the community. A 2-1 buydown cuts your rate by two percentage points in year one and one point in year two before returning to the note rate. Ask the builder to price both options, then compare the total cost over the years you expect to stay, not just the first-year payment.
Target finished homes. Spec homes that are already built are the ones builders most want to close before year end, and the fourth quarter is consistently the strongest window for buyers. Price cuts and incentives are richest on homes the builder can close quickly.
Check the incentives in writing. Common offers include closing cost credits, design centre credits, upgraded appliances and finishes, waived lot premiums, and rate buydowns through the builder’s preferred lender. Some offers cannot be combined with a price cut, and buydown offers usually require the builder’s preferred lender, so get the full terms before choosing.
Do not expect a crash. The forecasts available so far do not call for national home prices to drop. Fannie Mae’s October 2026 forecast projected prices rising about 0.6% in 2027, and the S&P Cotality Case-Shiller national index, which tracks repeat sales of the same homes, rose 2.1% year over year in August. What is falling is the price of new homes in a market with too much supply, not the value of housing as a whole.
What to Watch Next
1. The Census Bureau’s October new home sales report on 25 November. It will show whether the September median of $400,400 held, rose or fell again, and whether the 8.4 months of supply grew or shrank.
2. October pending home sales on 18 November. NAR’s contract-based reading will show whether buyers started coming back as rates eased, or stayed away.
3. The November builder confidence survey. The NAHB releases its November Housing Market Index in mid-November, and it will show whether the 43% share of builders cutting prices rose again, and whether buyer traffic recovered from 18.
4. The Federal Reserve’s December meeting on 8 and 9 December. Mortgage rates follow the bond market more than the Fed, but the meeting will shape expectations for rates into 2027.
For now, the picture is clear enough. New home prices are falling because builders have too many homes and too few buyers at 7% mortgage rates, and the cuts are real: 43% of builders cut prices in October, the median new home is down 3.9% year over year, and the average new home is down 6.7%. Buyers who were priced out a year ago now have room to negotiate, especially on finished homes, but they should compare a price cut against a rate buydown in writing before they sign.
Figures in this article come from the sources linked in the text: the U.S. Census Bureau and the Department of Housing and Urban Development for the September 2026 new home sales report, the National Association of Home Builders for the October 2026 builder survey, Redfin for the weekly housing market update to 8 November 2026, the National Association of Realtors for October 2026 existing-home sales, Freddie Mac for mortgage rates, Meritage Homes and Century Communities for third-quarter 2026 earnings, and Fannie Mae for the October 2026 price forecast. CNBC’s 9 November 2026 report, “New Home Prices Are Dropping”, first flagged the story.
Frequently Asked Questions
Are new home prices actually dropping?
Yes, on the official figures. The Census Bureau and HUD put the median new home price at $400,400 in September 2026, down 3.9% from $416,800 a year earlier, and the average price at $472,800, down 6.7%. The average price fall is statistically significant; the median fall is within the survey’s margin of error, so it should be read as a reported estimate rather than a proven fall.
How many builders are cutting prices?
In the National Association of Home Builders’ October 2026 survey, 43% of builders said they cut prices, the highest share recorded between 2020 and 2026. Those who cut took off 6% on average, and 65% of builders used sales incentives such as mortgage rate buydowns.
Why are new homes cheaper than existing homes right now?
The median new home was $400,400 in September while the median existing home was $416,700 in October. Existing homeowners with low locked-in mortgage rates are mostly staying put, so resale supply is tight at 5.1 months and resale prices keep rising. Builders, by contrast, have 476,000 homes for sale, or 8.4 months of supply, and have to sell what they built, so they cut prices.
What incentives are builders offering?
The most common are mortgage rate buydowns, closing cost credits, design centre credits, upgraded appliances and finishes, and waived lot premiums. Rate buydowns through the builder’s preferred lender are the dominant incentive in the current market. Century Communities said incentives on its third-quarter deliveries averaged about 13% of the price.
Is this the start of a housing crash?
The forecasts so far say no. Fannie Mae’s October 2026 forecast projected home prices rising about 0.6% in 2027, and the S&P Cotality Case-Shiller national index rose 2.1% year over year in August. What is happening is a correction in new home prices in a market with too much supply and 7% mortgage rates, while existing-home prices are still rising, just barely.
When will we know if the drop continues?
The Census Bureau releases October new home sales on 25 November, NAR releases October pending home sales on 18 November, and the NAHB releases its November builder confidence survey in mid-November. Together they will show whether prices, sales and buyer traffic kept falling or started to stabilise.
About the Author

Andy Abramson
Andy Abramson writes about luxury real estate, waterfront communities, and high-end lifestyle destinations. Andy’s guides focus on the detail behind a property, not just the listing: property records by address, name, and folio, closing timelines by loan type and state, and deeds and transfer rules checked against official sources, public records, and major news outlets. Andy also fact-checks high-profile homes and luxury rankings before publishing.
More from Insight Bullion